
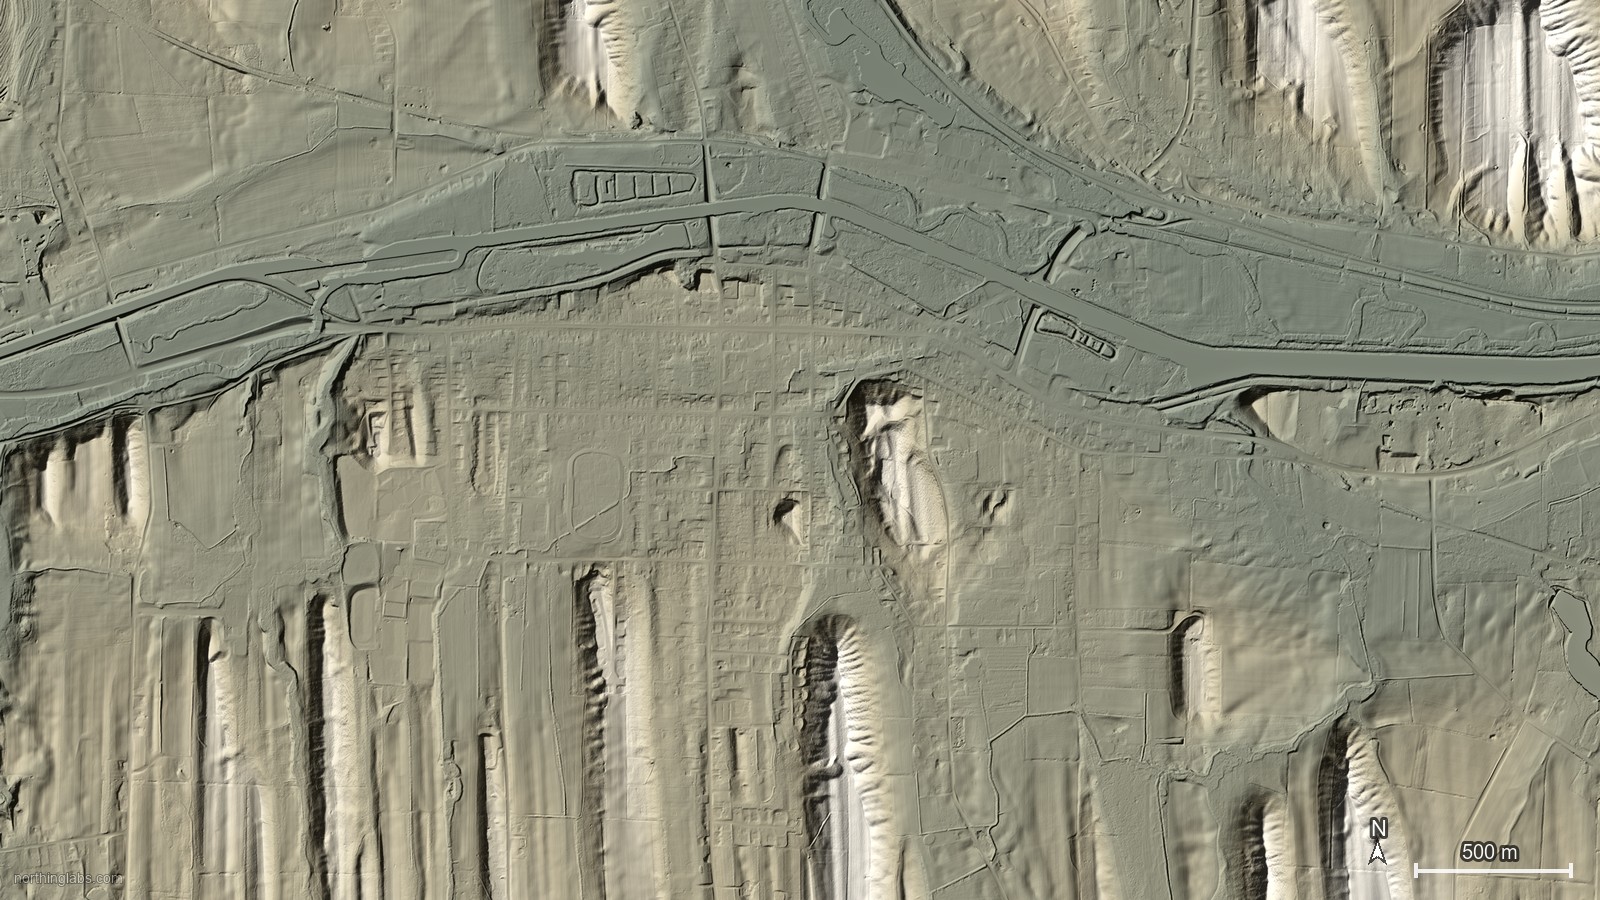
Say you've got a greenfield site, a free 3DEP DEM and no idea whether you're sitting on till, outwash or old lake clay. If there's a surficial map at all, it's probably at a scale that puts the whole site inside one polygon. Earlier this month the USGS published a paper that takes a real swing at that gap, and it's worth a look if you use terrain data for design.
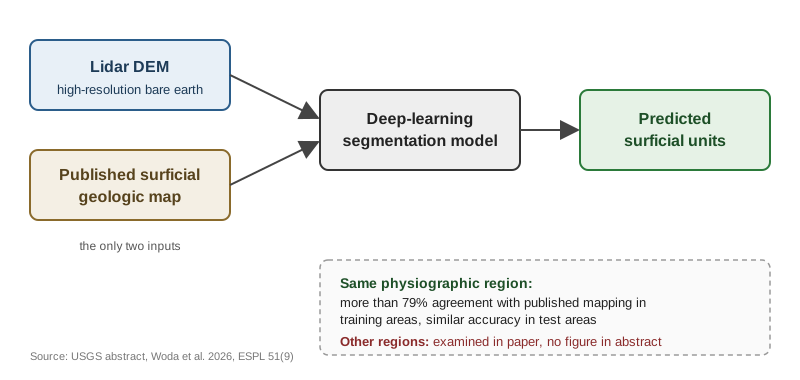
Four USGS scientists (Joshua Woda, Jason Finkelstein, William Odom and John Williams) trained deep learning models on just two inputs: high-resolution lidar and surficial geologic maps that were already published. In two parts of upstate New York the models reproduced the published mapping over more than 79% of the training areas, with similar accuracy in test areas inside the same physiographic region. So the takeaway is pretty simple. It's a fast, cheap first-pass materials map built from lidar you probably already have. It isn't a substitute for borings, and the accuracy is only shown close to where the model learned.
The paper is in Earth Surface Processes and Landforms (vol. 51, issue 9, dated 13 September 2026 in the USGS Publications Warehouse). On 17 September USGS followed it with the data release (training data, DEMs and validation data, all under CC0). One caveat up front: the full text sits behind Wiley and I couldn't read it. Everything below comes from the USGS abstract and the data release page, so there are no per-class accuracies and no specific map areas here, because I haven't seen them.
What they actually did
The two regions were picked to be about as different as upstate New York gets: the high-relief Allegheny Plateau and the low-relief Erie-Ontario Lowlands. In each one the model gets a lidar DEM and the existing surficial map, learns which terrain shapes go with which mapped unit, then predicts units from the DEM alone.
The abstract says the models were developed iteratively by "exploring different groupings of surficial deposits." I read that as lumping units into broader classes until the model could actually tell them apart, which makes sense. A DEM can probably separate a drumlin from a floodplain, but maybe not two flavours of till.
The tooling is the part I like most. The data release lists ArcGIS Pro 2.9 or later with its deep learning tools, and the methods follow Odom and Doctor (2023). That earlier USGS paper used a U-Net convolutional network on lidar to classify alluvium and exposed bedrock in the Neversink River watershed in the Catskills, then paired that with geomorphometry to estimate minimum depth to bedrock and checked it against boreholes and seismic data. It did better on shallow deposits than deep ones, which is worth remembering.
So this isn't a research-only pipeline. It's a stock desktop GIS toolset, a statewide lidar DEM and maps the state survey already has. No field campaign, no exotic sensor, and the authors say outright that the idea is to be "easily reproducible using widely accessible datasets."
Why it works in glaciated terrain
The model is basically reading landform shape. That works where landform and material go together, and glaciated New York is about the best place in the country for that.
Take the Palmyra area in Wayne County. Upstate New York has one of the largest drumlin fields in North America, something like 10,000 drumlins over roughly 12,000 km² between Lake Ontario and the Finger Lakes. A USGS aquifer study of the Fairport-Lyons channel system describes the drumlins there as "composed mostly of glacial till," lodgment till with a cap of looser ablation till. The old meltwater channels that wind between them hold "interlayered glaciofluvial sand and gravel and fine-grained lacustrine deposits." The same study says lidar helped them pick out eskers and other ice-contact deposits too.
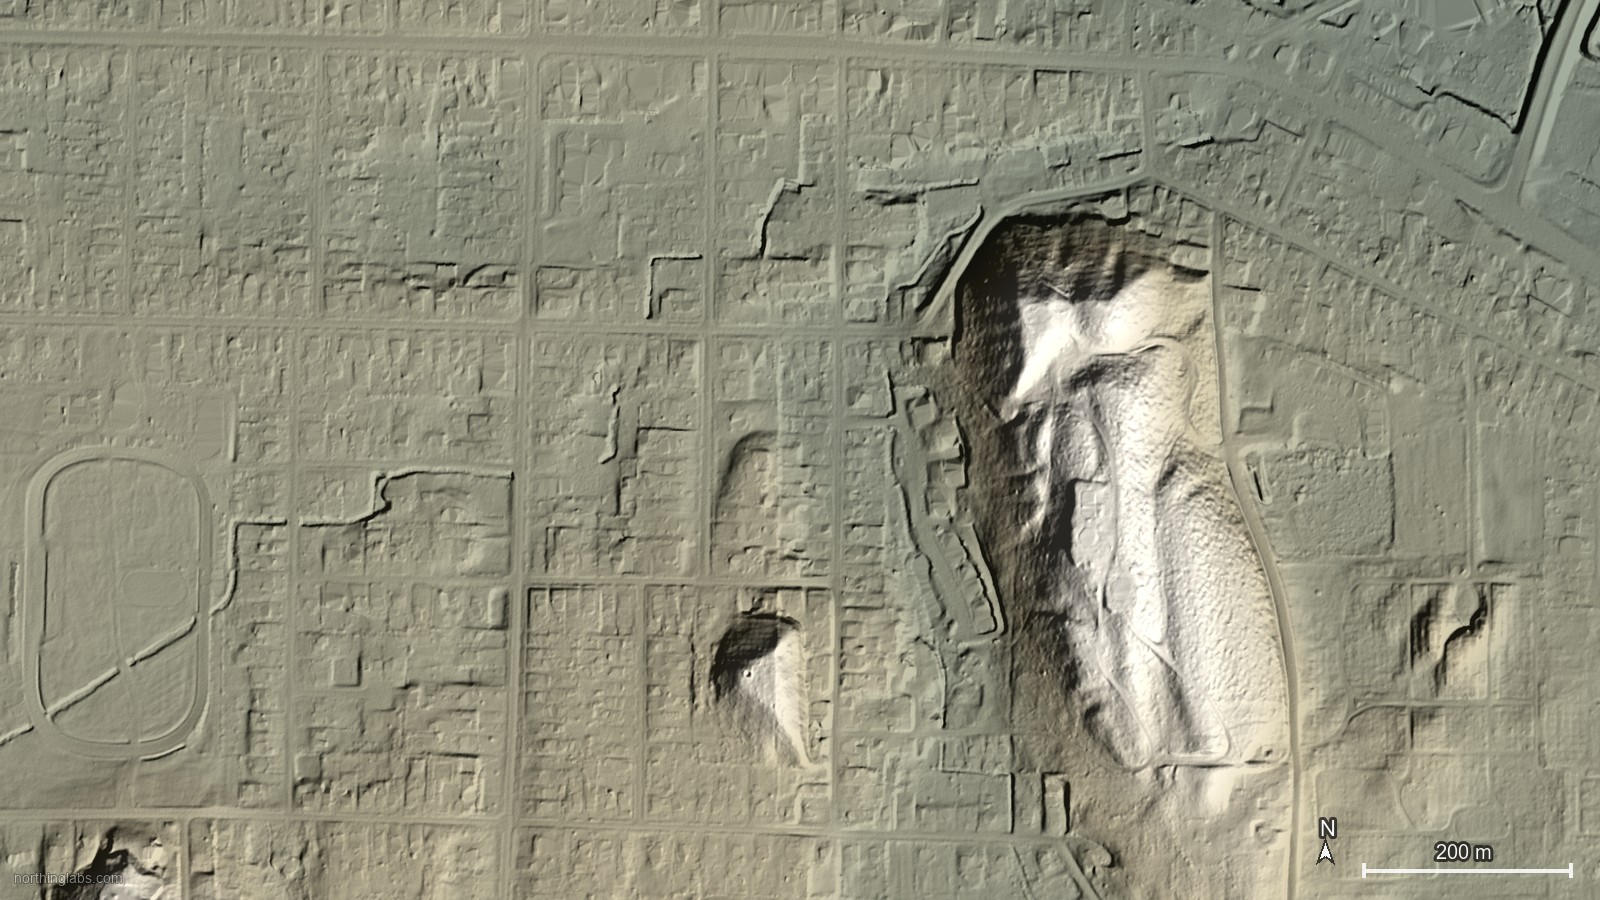
Look at a bare-earth hillshade of that area and you can see it. The streamlined hills are till, and the flat, sinuous low ground between them is where the sand, gravel and lake silt ended up. A mapper reads that off the hillshade and so, apparently, can a neural net. (These views show the kind of terrain in the region. They aren't the paper's training tiles, which I couldn't confirm.)
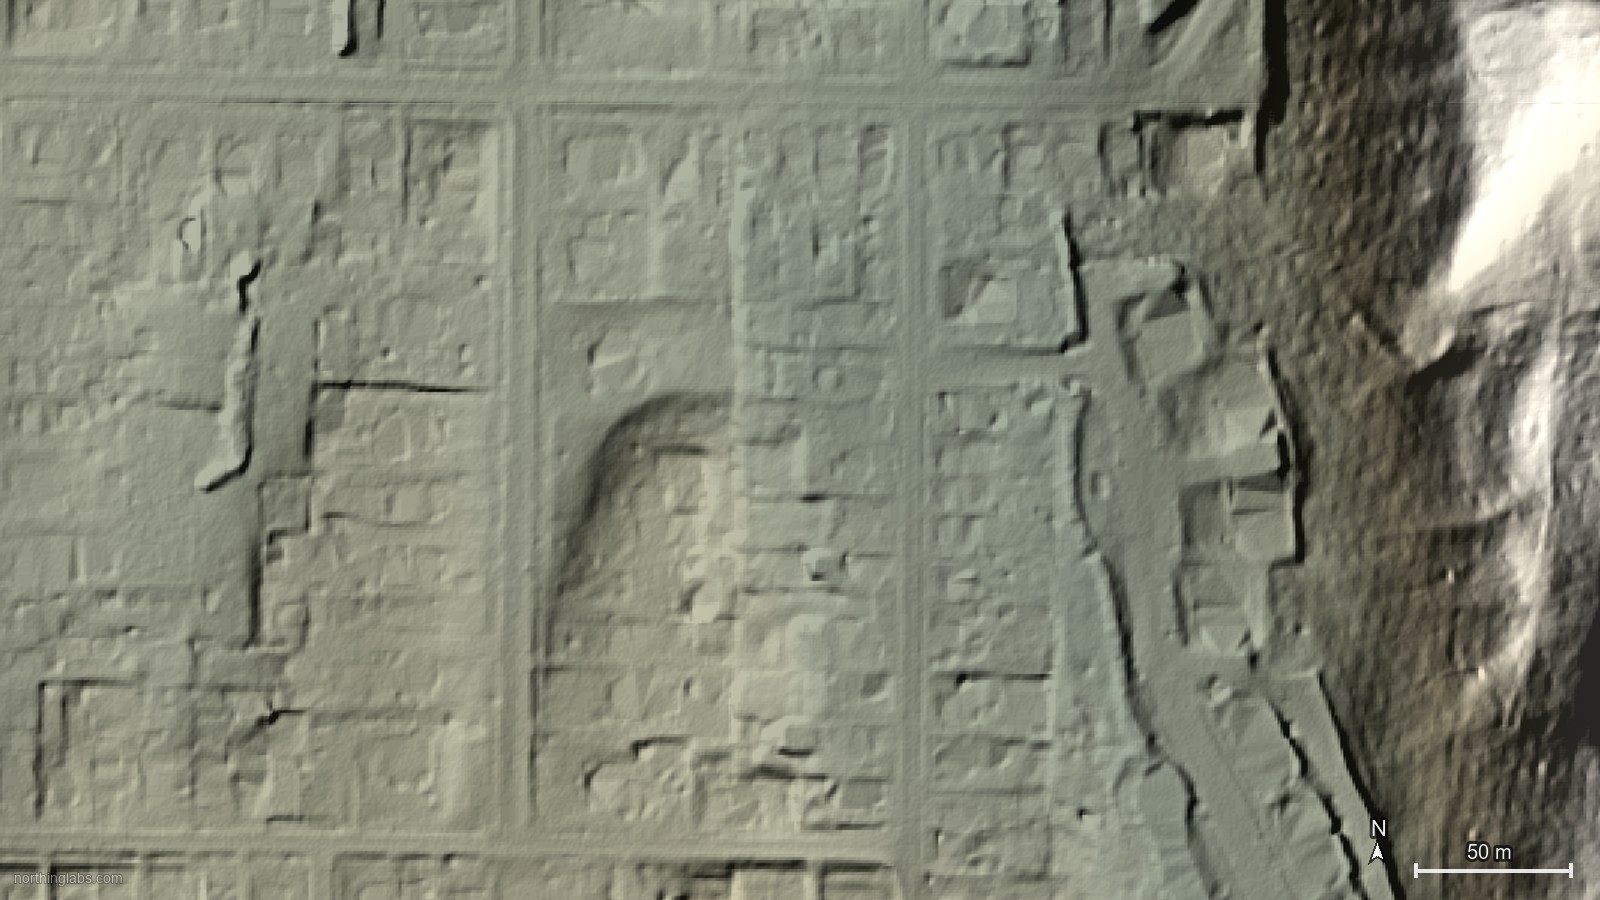
For a site designer that difference is huge. Till on a drumlin flank vs. outwash in the channel next door means different bearing, different infiltration, a different septic design and a different dewatering story. Knowing roughly where that line falls before you lay anything out is worth a lot.
Where it stops working
The headline number only holds up close to home. The 79% plus is for training areas, and the "similar accuracy" is for test areas in the same physiographic region. The abstract says the paper also looks at "testing models in physiographic regions outside of their training areas" and how that affects performance, but it doesn't give a number. Without the full text I wouldn't assume a Plateau model is any good in the Lowlands, and I definitely wouldn't point it at Ohio.
It's also only as good as the maps it learned from. The authors say so themselves: "Key to the development of deep learning models is the availability of highly detailed surficial geologic maps in each of these regions." That's the catch. The places that most need a surficial map are the places with no detailed map to train on, so there you're relying on transfer from somewhere else, which is exactly the part that isn't shown yet.
Then there's what 79% actually means. It's agreement with a published map, and that map is itself one geologist's interpretation, not ground truth from borings. In round numbers it also means about one cell in five doesn't match. Over a county that's a useful map. On a two-hectare lot, your site could easily land in the fifth that's wrong.
I'd also expect it to struggle wherever shape and material come apart. Think thin veneers over bedrock, graded or filled ground, or a flat surface that could be a lake plain or an outwash plain. The earlier Neversink work already found the lidar method weaker for deeper sediments, which fits. And the abstract frames the whole thing as a way to "help increase efficiency" of mapping, so it's there to speed mappers up, not replace them.
What it means day to day
I'd treat an output like this as a desk-study layer, same as the soil survey or an old well log. It's good for spotting that a site straddles a drumlin and a channel, then putting one boring in each instead of two on the same hill. It helps with early calls on infiltration or where the sand and gravel might be. It doesn't go on a drawing as the geology.
The bigger deal is for state surveys. 3DEP products are free with no use restrictions, the USGS data release is CC0 and the tools are off the shelf. So any survey with lidar and a few well-mapped quads could try building a model for its own glaciated terrain and see how far it carries. If someone does that and publishes cross-region numbers, that's the result practitioners should really be watching for.
Anyone who's started a layout without knowing whether they're on till or outwash will find this useful. Just read the fine print about where it stops working.
Northing Labs is building tools that bring public terrain data into CAD. Coming soon, join the list to hear when it launches.
Sources
- USGS Publications Warehouse: Deep learning models for mapping surficial geology in selected physiographic regions of New York (ESPL 51(9), 2026, doi:10.1002/esp.70411)
- USGS publication page and abstract: Deep learning models for mapping surficial geology in selected physiographic regions of New York
- USGS data release: Deep learning models for mapping surficial geology in selected physiographic regions of New York (CC0, doi:10.5066/P13BPGDZ)
- USGS: Rapid estimation of minimum depth-to-bedrock from lidar leveraging deep-learning-derived surficial material maps (Odom and Doctor, 2023)
- USGS SIR 2021-5086: Hydrogeology of aquifers within the Fairport-Lyons channel system, Wayne, Ontario and Seneca Counties, New York
- Origin of drumlins on the floor of Lake Ontario and in upper New York State (Sedimentary Geology)
- USGS 3D Elevation Program
- USGS 3D Elevation Program (3DEP) Lidar Explorer