
Most lidar stories stop at the DEM. Someone flies it, someone makes a nice hillshade, and that's about it. Yarra Ranges Shire, on the eastern edge of Melbourne, has gone a step further. Earlier this month the council adopted Amendment C225, which redraws its Erosion Management Overlay (EMO) from a lidar-derived terrain model. So a slope raster is now, more or less, the line that decides who needs a geotechnical assessment before they build, subdivide or clear.
It isn't final yet. The amendment still goes to the Minister for Planning, and the interim controls (Amendment C230) stay in place until 7 October 2027 or until C225 is finalised. But the method has already been through exhibition, 88 submissions and a planning panel, and that's the part worth reading if you use terrain data for anything with consequences.
The old overlay dates from 2001 and rests on a 1999 landslip zoning study. WSP's April 2025 basis-for-mapping report says the best topography back then was 1960s contour maps from the Melbourne Metropolitan Board of Works, and the criteria were applied with scale rules on hard-copy maps. The new mapping uses 1 m elevation grids from lidar flown between 2015 and 2017, sourced from the state.
The clever bit is they didn't change the rules. The 1999 criteria are basically a lookup table of geology against slope band. For example, in the rhyodacites of the Dandenong Ranges anything steeper than 11° counts as medium susceptibility, while in the Silurian and Devonian sedimentary rocks it takes more than 22°. Any ground that has already slid is high, at any slope. WSP checked those thresholds against slope histograms inside and outside known landslides, found they still held up, and then just re-ran them on the lidar. That's a much easier thing to defend at a panel than a new model.
The bigger change came from the landslide inventory. Mapping scarps, hummocky ground and debris lobes off the lidar took it from 167 mapped landslide polygons covering 24.4 km² to 912 polygons covering 62.5 km². A lot of those sit under tall wet forest where air photos never showed the ground. The report says most of the growth in the overlay comes from those newly found landslides, and the rest from more accurate slope angles.
Then there's the raster work. Slope was calculated from the 1 m grid and aggregated to 10 m cells, and each cell was classed against the table. The pixel map was turned into smoothed polygons with a custom GIS script plus manual editing. Polygons where less than half the cells hit the threshold were dropped. So were polygons smaller than 95% of observed landslides in that geology (between 1,084 and 6,125 m² depending on the unit). Road cuttings, dam walls and quarries were removed by hand. Debris flow runout was taken down the gullies below mapped source areas using a University of Melbourne runout method, with a nominal 20 m either side of each new channel.
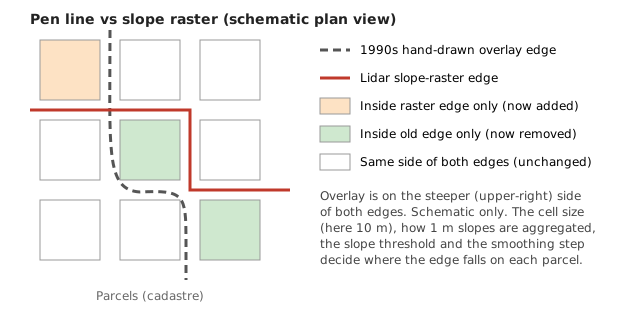
The lines moved both ways, which is what you'd expect when a raster replaces a pen line. At exhibition the WSP report had 3,259 properties added and 937 removed (a net 2,322 added), and the landslip area going from 112 to 137 km². Then the submissions came in. WSP sent engineering geologists with hand-held inclinometers to 34 properties near the edge. At 30 of them the natural slope was close to or just under the threshold, and earthworks were skewing the result. So the boundary was redone at 1:1,500 with an algorithm that flagged susceptible cells with fewer than four susceptible neighbours, and the mapped area dropped to 117 km².
The headline numbers are a bit of a mess, and that matters too. The council's page quotes 9,079 properties newly mapped for landslip and 358 for debris flow under the interim overlay. I couldn't reconcile those with the report's counts. Lidar News reported more than 2,000 added and nearly 1,000 removed, which looks like the April 2025 exhibition figures rather than the adopted map. So if you're quoting a number to a client, check which version it came from.
Now for the take. First, edge effects are real, and now they're legal. Say your lot is on sedimentary rock and the hillside averages somewhere between 21° and 23°. Whether it trips the overlay depends on how the 1 m slopes were rolled up into 10 m cells, whether a cut batter or driveway falls inside a cell, and how the smoothing script drew the polygon. Even the report describes the 10 m step two ways (maximum slope per cell in one section, average in another). Submitters raised exactly this, with retaining walls, driveways and even roof tiles being read as slope. The 30-of-34 finding says they weren't wrong to ask.
Second, the soil objection. The panel report sums up a group of submissions as saying "LiDAR and modelling are too broad-scale and do not reflect site-specific conditions", and that "Geological or soil conditions (e.g., shallow rock) are stable and shouldn't trigger EMO inclusion." I think that's half right. Geology is in the model, but it's the 1:250,000 state geology map. A 0.5 mm line at that scale is about 125 m on the ground, so the geometry is at 1 m while the strength proxy is at a scale where a boundary could be off by a few lots. (WSP did adjust the Older Volcanics boundaries by eye from the lidar, which helps.) And the panel heard plainly that there's no practical way to map depth to rock across the shire. That gets handled in the site assessment instead, and the incorporated document lets a qualified geotechnical engineer show the criteria aren't met and get the assessment requirement waived. So the system treats the map as a screening tool. That's the right way to hold it, as long as the site geotech actually does the work.
Third, the thresholds carry weight now. The Monbulk-Seville Road landslide moved on an average slope of about 5° in the Older Volcanics, where the threshold is 9°. WSP considered dropping the threshold to 5° everywhere, and decided instead to map old landslides in those volcanics in detail, since every recorded movement there was a reactivation. That's a sensible call, but it's a judgement call, and it decides which lots are in. The peer reviewer also noted that splitting the slope bands more finely would shift the boundary a little, and concluded no adjustment was warranted.
Fourth, canopy. The council's Part B submission told the panel that "LiDAR is not affected by dense canopy or rugged terrain." I'd put that more carefully. Lidar gets through canopy far better than photos do, which is the whole reason the inventory grew fivefold. But under dense mountain ash and fern understorey the ground returns thin out and the classifier does more of the work, and aggregating to 10 m hides a lot of that. There's a flip side too. Once a scarp is visible on a public DEM, I think it gets harder for a council or consultant to argue they couldn't have known about it. That cuts both ways for liability.
So what would I check on a lot in or near one of these overlays? Start with which schedule applies and why. WSP made the point that geotechs are often told only that the EMO applies, not why, and debris flow can come from well upslope of a flat site. Then check whether the overlay covers only part of the lot, because the council says the requirements only apply to the area it covers. Compare the site today with a 2015 to 2017 surface, since cuts, fills and walls built since then aren't in it (and older ones may be driving the slope). And check lidar coverage, because the report says a few small areas in the west were assessed without it.
The good news is the method is published, the criteria are a table you can read, and the edge was ground-truthed when people pushed back. That's more than most hazard layers can say. It just means the line on the map is only as good as the cell size, the threshold and the geology behind it, and now all three have legal weight.
Northing Labs is building tools for civil and survey work, starting with public terrain data straight into CAD. Coming soon, join the list.
Sources
- Yarra Ranges Council: Amendment C225 Erosion Management Overlay Mapping Review
- WSP for Yarra Ranges Council: Erosion Management Overlay, Basis for Mapping Amendment (April 2025, PDF)
- Planning Panels Victoria: Yarra Ranges C225yran Panel Report (13 July 2026, PDF)
- Lidar News: Yarra Ranges Overhauls Landslide Hazard Mapping
- Wikimedia Commons: Sherbrooke Forest Dandenong Ranges (hero photo)
